Donald Wheeler in his classic book1 demonstrates why you can use process behavior charts for all your count-based data.
Wheeler uses the term XmR Chart in his description. An XmR Chart is the same chart we call an I Chart in the PBCharts Excel Add-In. For this article we use the term “process behavior chart” interchangeably with the term “I Chart.”
“Thus, while p-charts, np-charts, c-charts and u-charts use theoretical models to create theoretical limits, the XmR Chart lets the data define appropriate empirical limits. This means that you can use an XmR Chart with count-based data anytime you wish. Since the p-chart, the np-chart, the c-chart, and the u-chart are all special cases of the chart for individual values, the XmR chart will mimic these specialized charts when they would be appropriate. However, when the specialized charts are inappropriate, the XmR chart will still work because it uses an empirical approach rather than being based on a specific probability model. Therefore, if you do not know how to verify a particular probability model, or if do not care to do so, you can still use an XmR chart with your count-based data.
Thus, you can’t go wrong by placing your count-based data on an XmR Chart.”2
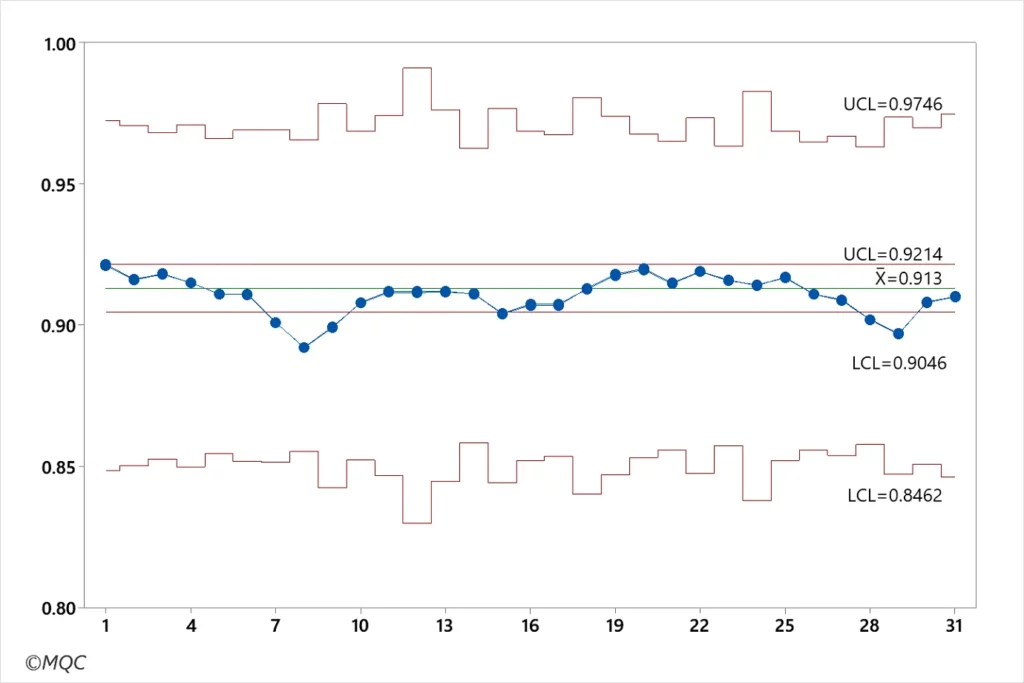
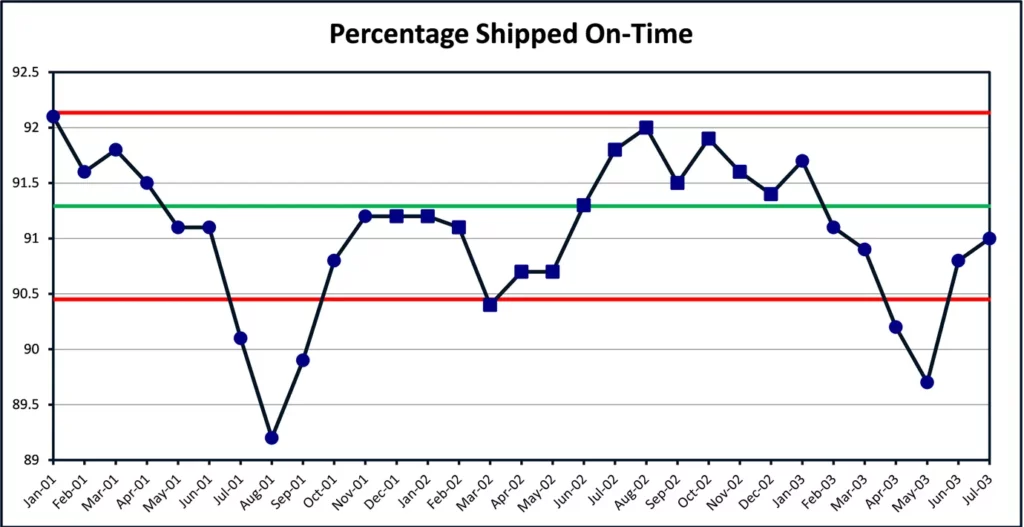
He gives an illustration3 of an inappropriate use of a p-chart for On-Time Shipments, because p-charts are based on binominal distribution model.
“These theoretical p-chart limits are incorrect because the binominal model is inappropriate for these data. Specifically, the probability of a shipment being on time is not the same for all of the shipments in any given month. The empirical limits of the X Chart, which do not depend upon the appropriateness of any particular probability model, are the correct limits for the data in Figure A.12.”
In this case the limits of the p-chart are almost five times wider than those of the process behavior chart. Figure 2 is the process behavior chart made with the Excel PBCharts Add-In.
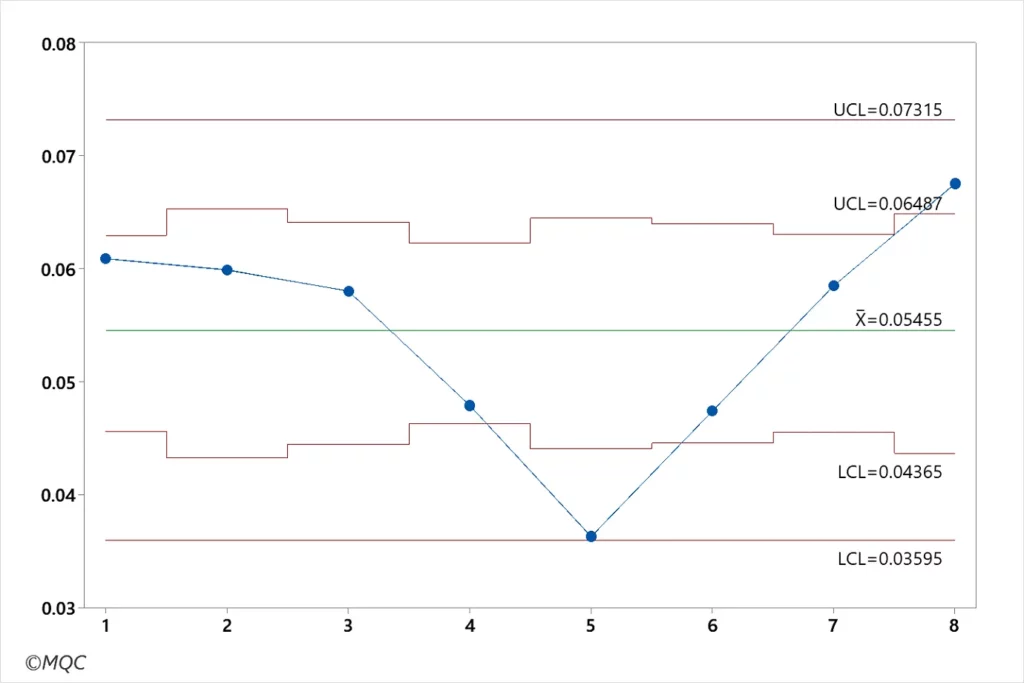
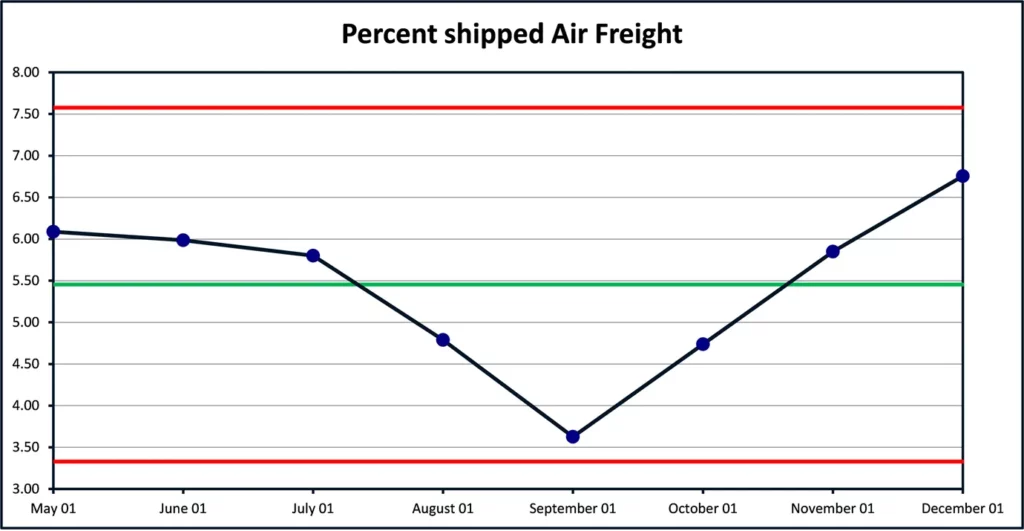
The limits produced by p-charts can also be narrower than those produced by process behavior charts. Wheeler gives a second example4 shown in Figure 3 and Figure 4.
- Donald J. Wheeler, Understanding Variation: The Key to Managing Chaos 2nd Edition (Knoxville, TN: SPC Press, 2000), 140-142.
- IBID 142
- IBID Figure A.12, 141. Reproduced using Minitab 21©, as Figure 1 in this article.
- IBID Figure A.13, 141. Reproduced using Minitab 21©, as Figure 2 in this article.
No responses / comments so far.