I got an email from a customer asking if PBCharts followed the UK based East London NHS Foundation Trust guideline on how to remove astronomical points.
“Hello Mike, I have attached an I chart guide from the East London NHS Foundation Trust that neatly notes how to calculate the limits for an I Chart and how to recalculate once for an astronomical point. Does PBCharts recalculate using this method?”
Here is what he provided.
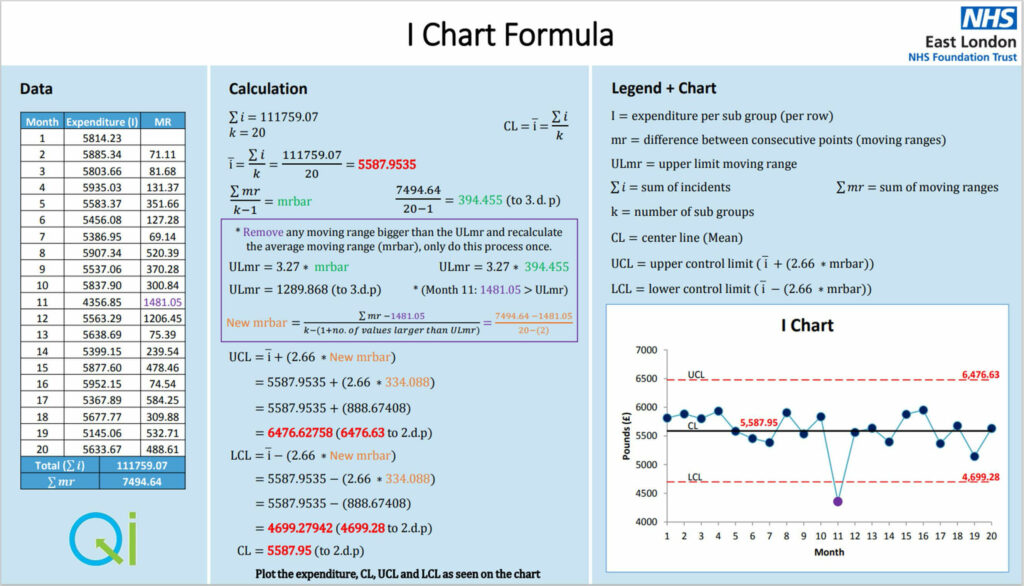
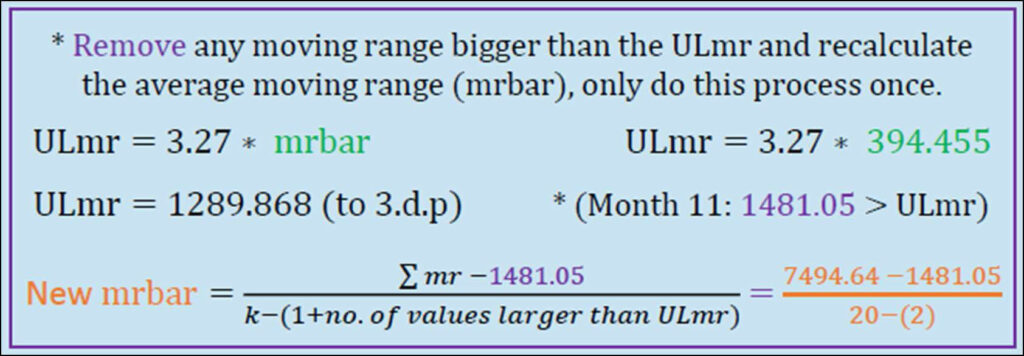
The key instructions have been reproduced below instructing one how to remove a moving range bigger than the upper natural process limit on the moving range chart.
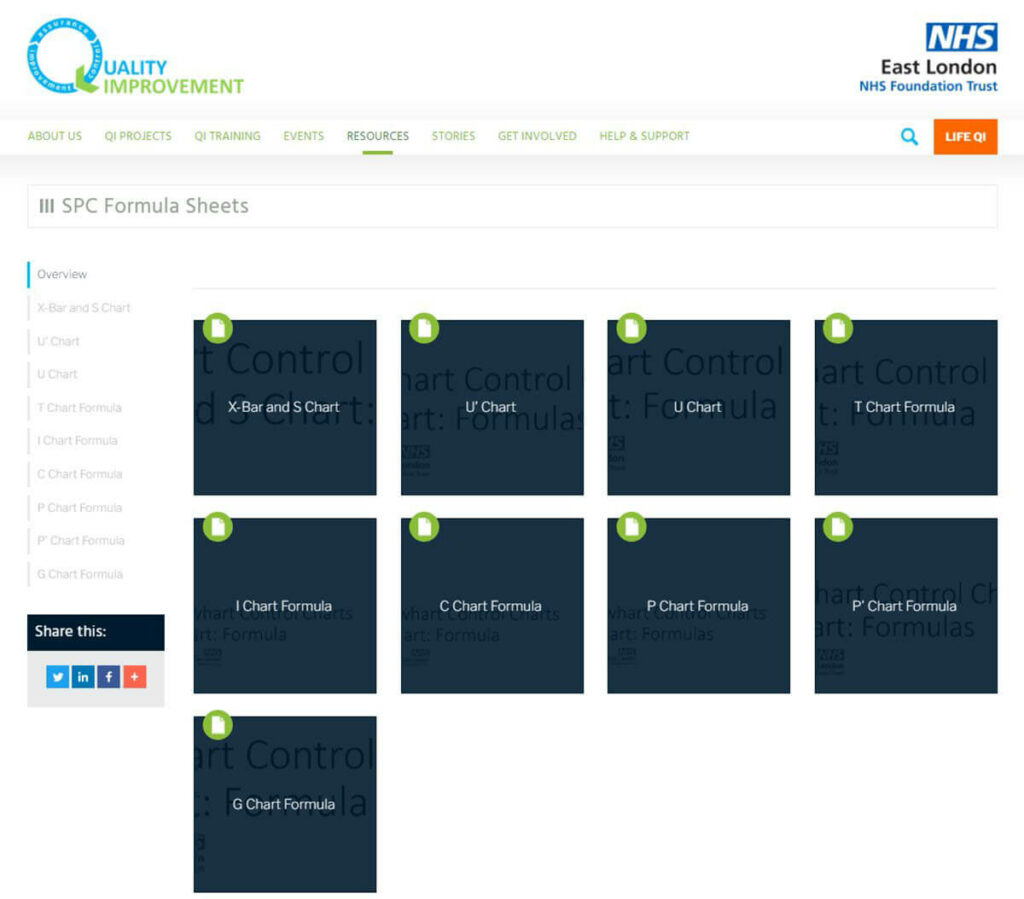
The NHS has a website devoted to quality improvement and have several control chart guides located at the following website.
https://qi.elft.nhs.uk/collection/spc-formula-sheets/
The specific I Chart guide is located at the following website.
https://qi.elft.nhs.uk/wp-content/uploads/2017/03/I-Chart-Formula.pdf
The answer to his question is YES!
PBCharts can exclude points from either the I Chart or the MR Chart or both simultaneously. But certainly not using the instructions provided by the NHS Foundation Trust example. To explain we need to follow the recommended workflow that is built into the Excel PBCharts Add-In.
The recommended workflow is indicated by the order of the Worksheet tabs at the bottom of PBChart page:
1. Enter Data first
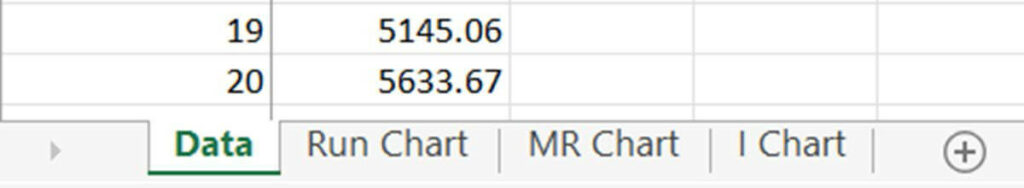
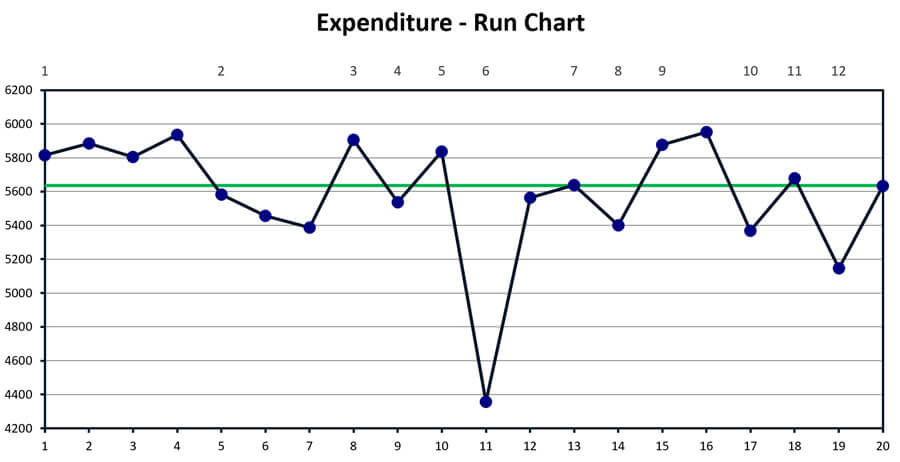
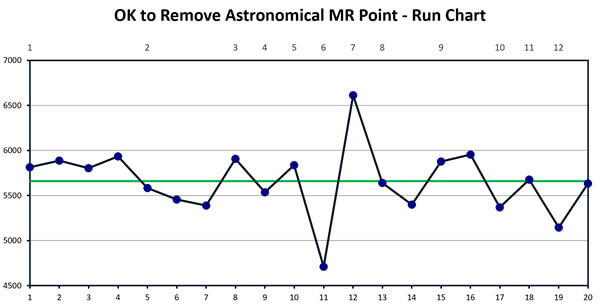
2. Go to the Run Chart tab and run the two run tests to examine for special causes.
| Runs About Median | Expected Runs | Clustering/Mixture Test |
| 12 | 11 (7 to 15) | No Pattern |
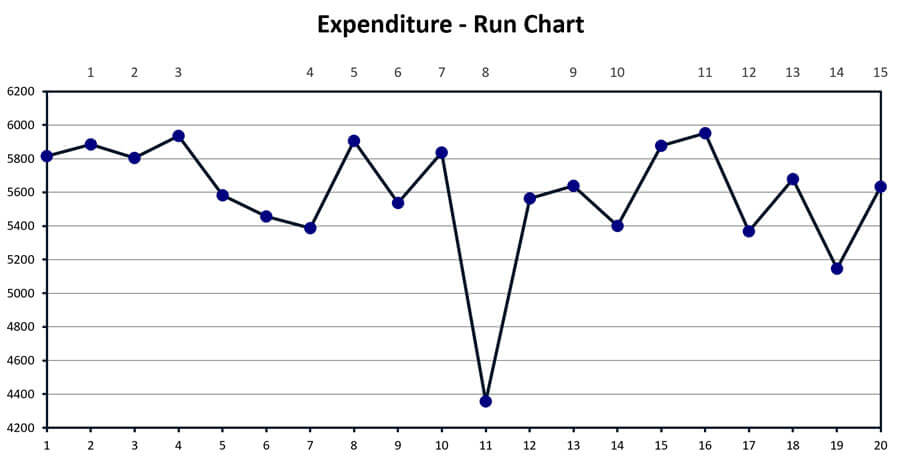
| Runs Up or Down | Expected Runs | Trends/Oscillations Test |
| 12 | 10 (10 to 16) | No Pattern |
No special causes for Clustering/Mixture and Trends/Oscillations were detected by the Runs About Median runs test nor the Runs Up or Down runs test. However, it is easy to observe the unusual data point at Month 11.
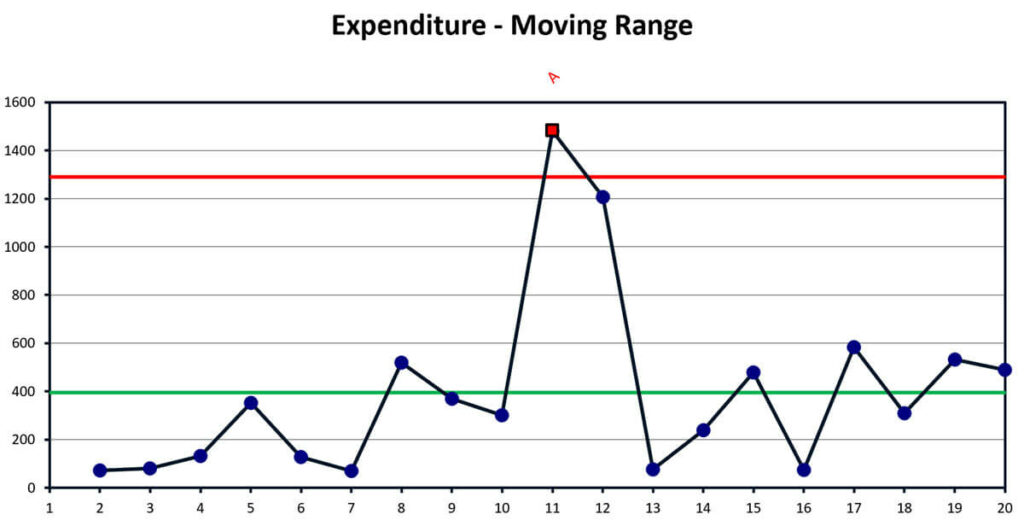
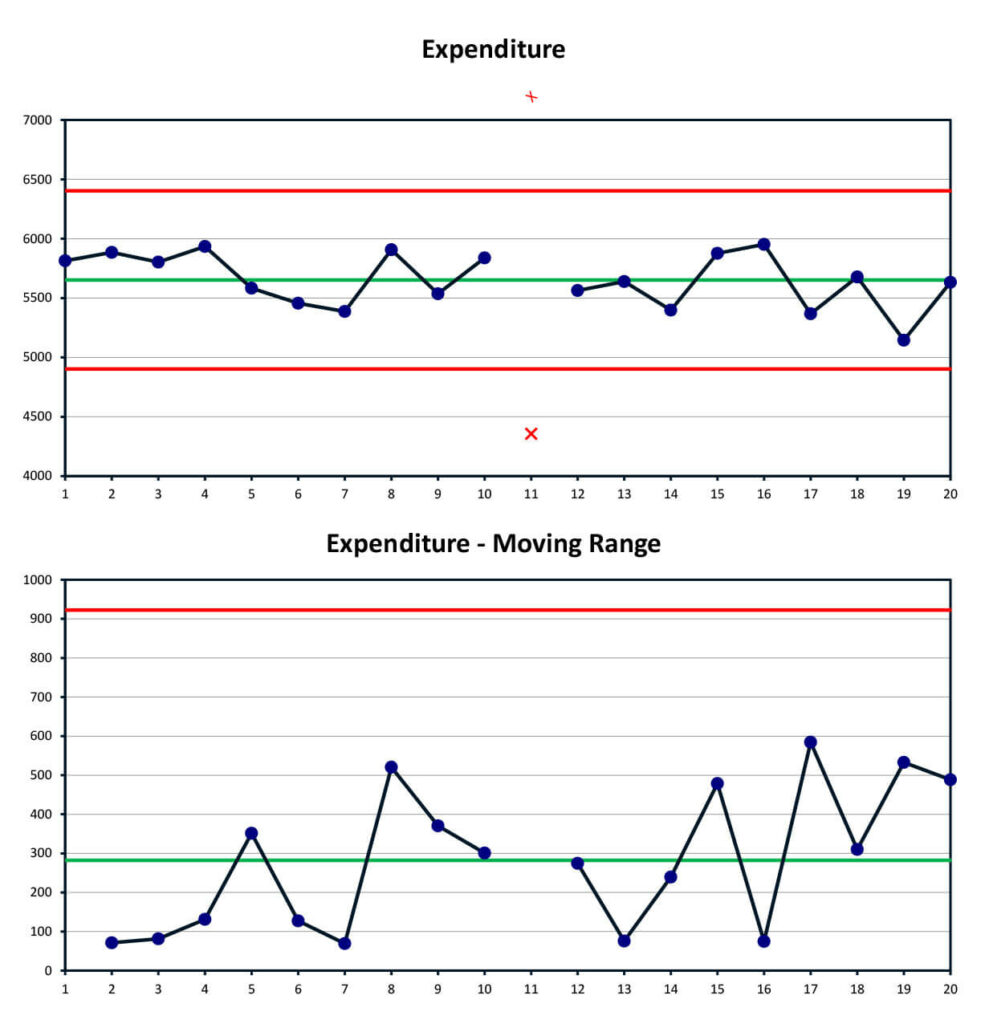
3. Go to the MR Chart tab and examine the uniformity of the moving range values. Look for two specific indicators.
- Assignable Cause Pattens.
- An apparent shift in the magnitude of the points from one location to the other.
Assignable cause patterns
A: Large shift, 1 point outside limit.
B: Unspecified shift, 9 points in a row on same side of centerline
C: Trend, 6 points in a row all increasing or decreasing
D: Alternating up and down, 14 points in a row
X: Excluded from analysis
There is one point outside the upper Natural Process Limit, but if we follow the NHS Foundation Trust guide before examining the I Chart we will make the same mistake demonstrated in their example.
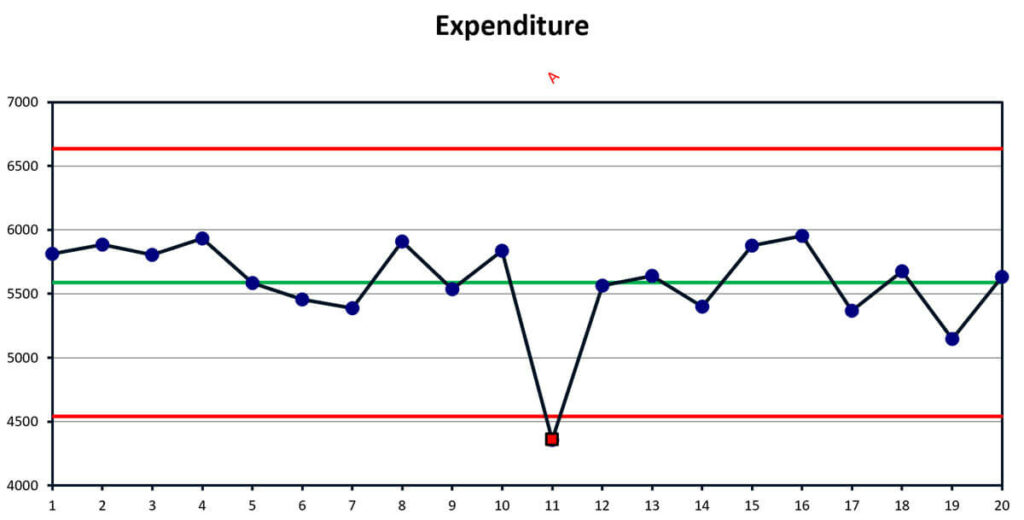
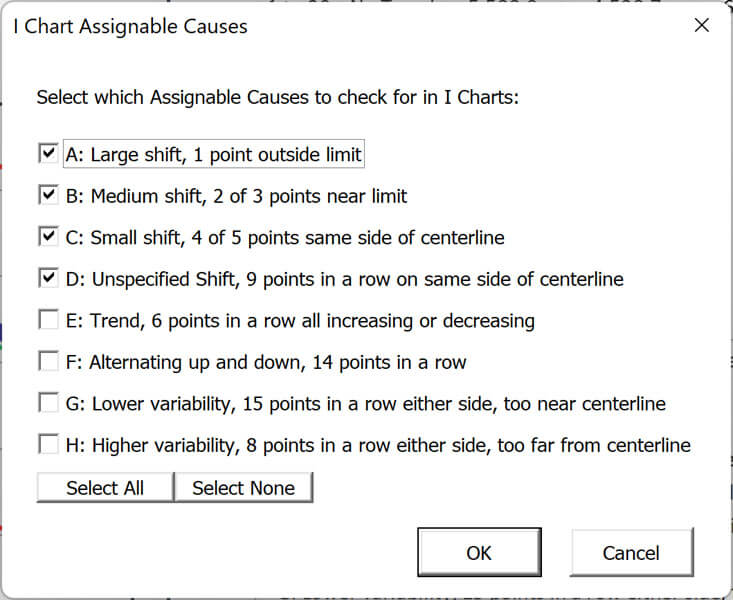
4. Go to the I Chart Tab and observe any identified Assignable Cause Patterns.
Assignable cause patterns
A: Large shift, 1 point outside limit.
B: Medium shift, 2 of 3 points near limit
C: Small shift, 4 of 5 points same side of center line
D: Unspecified shift, 9 points in a row in same side of centerline
E: Trend, 6 points in a row all increasing or decreasing
F: Alternating up and down, 14 points in a row
G: Lower variability, 15 points in a row either side, too near centerline
H: Higher variability, 8 points in a row either side, too far centerline
X: Excluded from analysis
The conventional eight Assignable Cause Patterns are available in PBCharts. We use Dr. Wheelers favorite four patterns as a default, but you can select your own favorites from the Other Setting drop down menu. Notice they are described in everyday English instead of the usual statistical jargon.
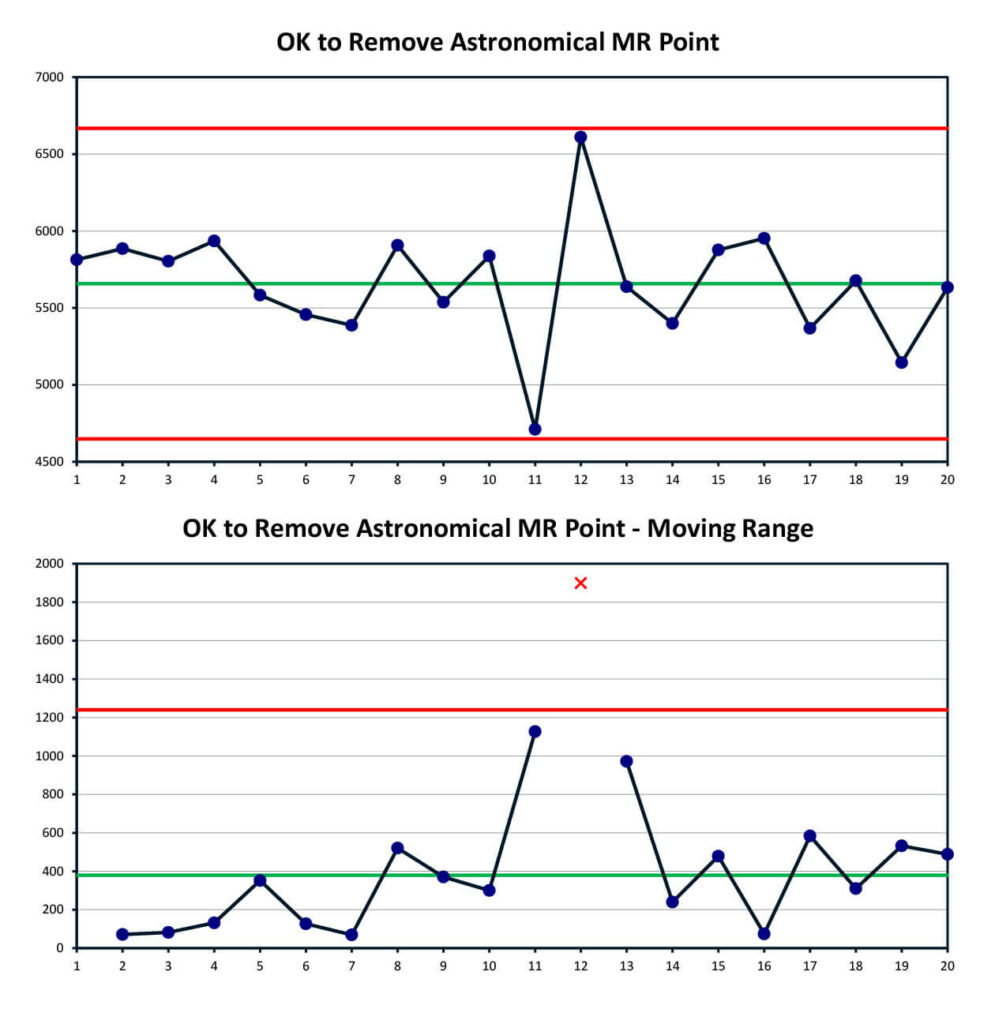
We now observe that we had a spike on all three charts. It is especially important to note that any big shift of one point on an I chart will generate two large points on the Moving Range Chart, see below.
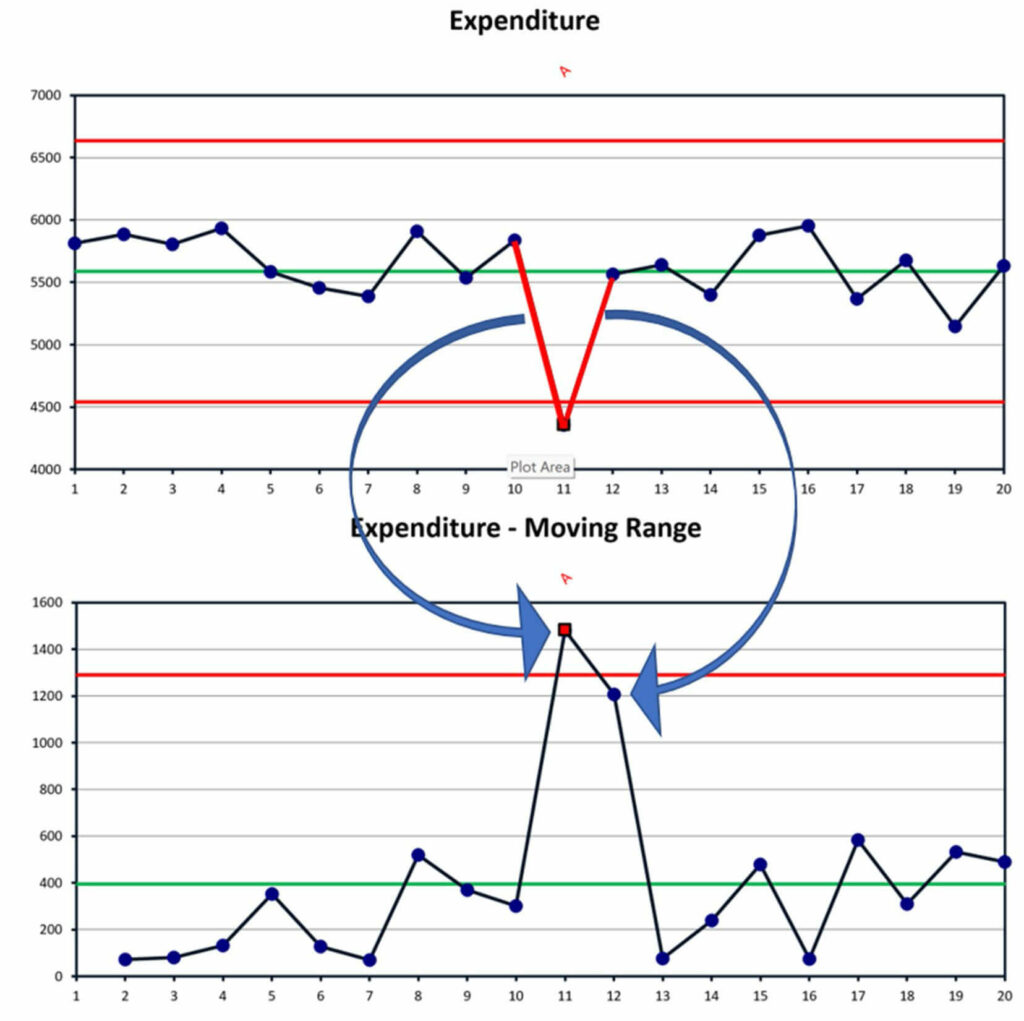
If we excluded the assignable cause pattern at month 11 on the Moving Range Chart, it would only escalate the point at month 12 to be an assignable, cause pattern.
But we are advised to only remove one astronomical point on the Moving Range Chart.
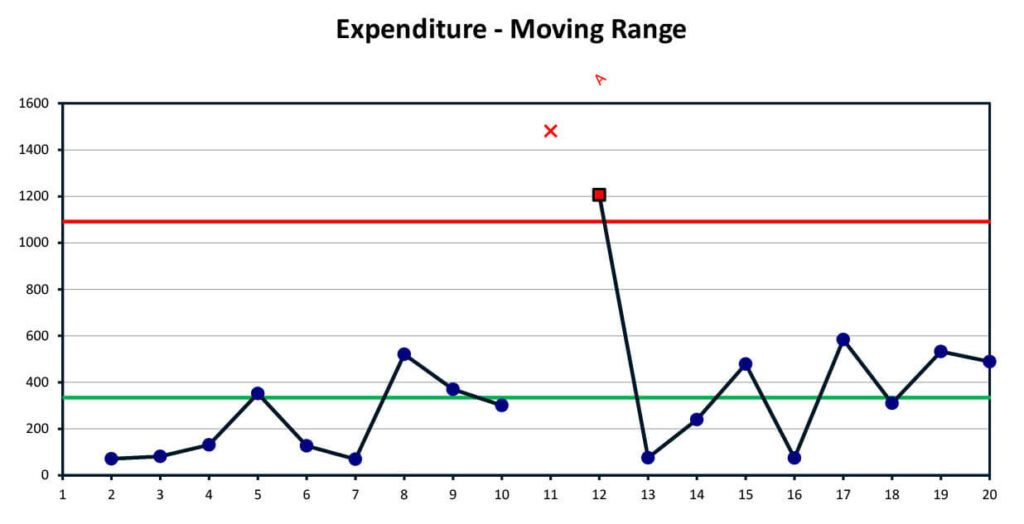
In this case we see that we see we should exclude the assignable cause pattern at month 11 on the I Chart instead of excluding the assignable cause pattern on the Moving Range Chart.
Notice the I Chart natural process limits are also tighter because of the elimination of the artificially inflated moving range at month 12.
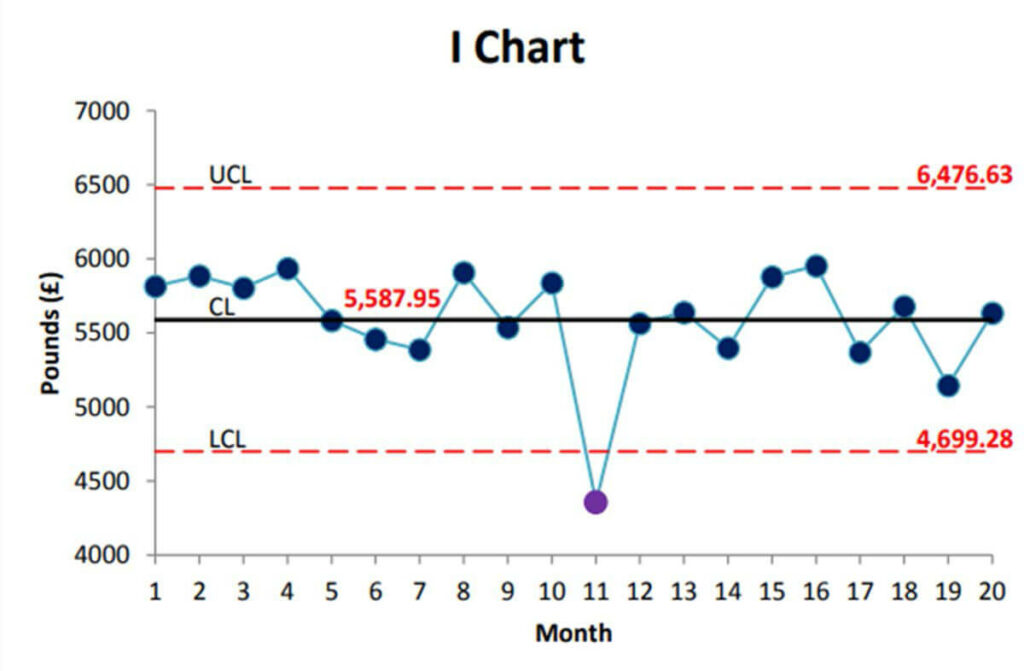
| Period | Trend | Centerline | Lower Limit | Upper Limit |
| 1 to 20 | No Trend | 5,652.7 | 4,901.8 | 6,403.7 |
The Proper Conditions Needed to Follow East London NHS Trust Recommendations
The following example will show the conditions where following the East London NHS Foundation Trust guideline would be appropriate.
Again lets follow the recommended PBCharts Workflow and examine the run charts, MR Chart and finally the I Chart.
No special cause patterns on the Run Charts.
| Runs About Median | Expected Runs | Clustering/Mixture Test |
| 12 | 11 (7 to 15) | No Pattern |
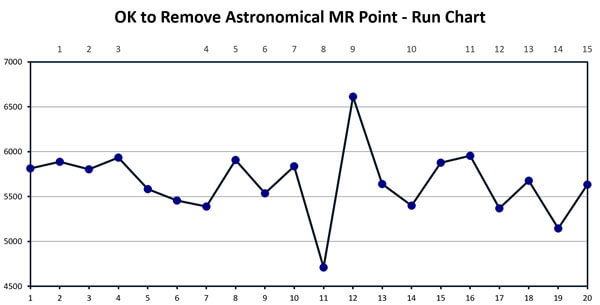
| Runs Up or Down | Expected Runs | Trends/Oscillations Test |
| 15 | 13 (10 to 16) | No Pattern |
There is a special cause pattern on the Moving Range Chart.
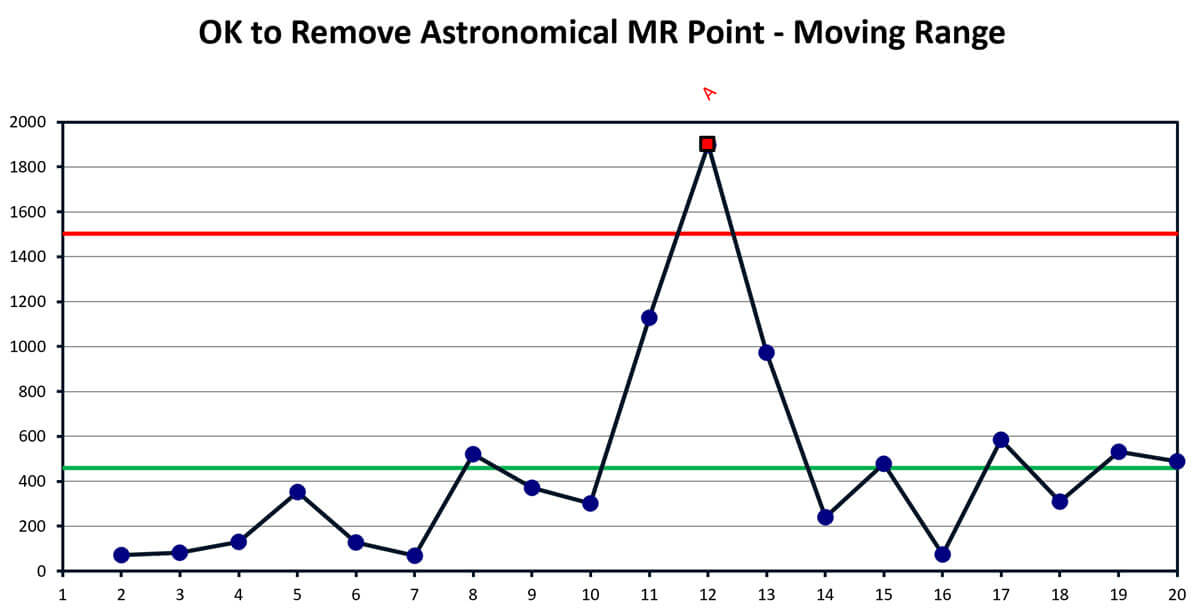
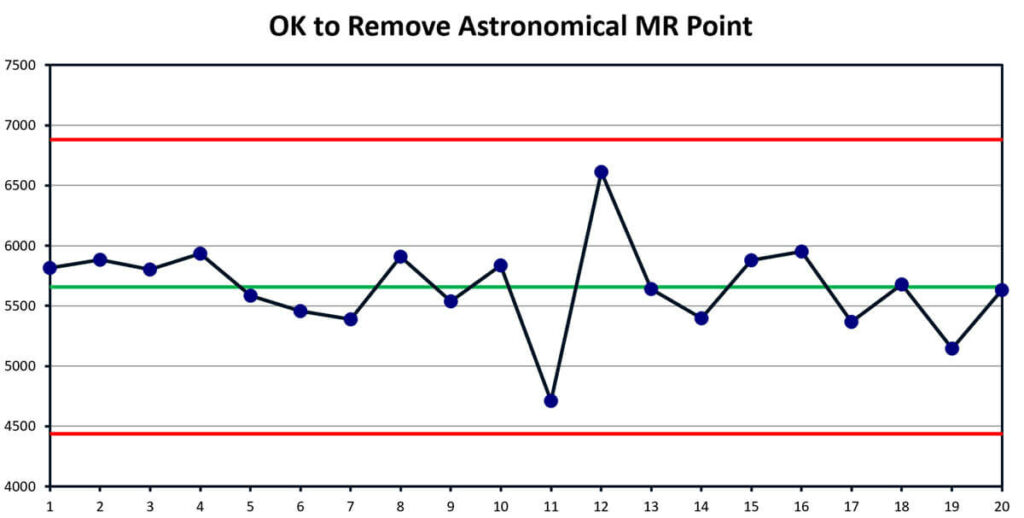
However there is no special cause pattern on the I Chart.
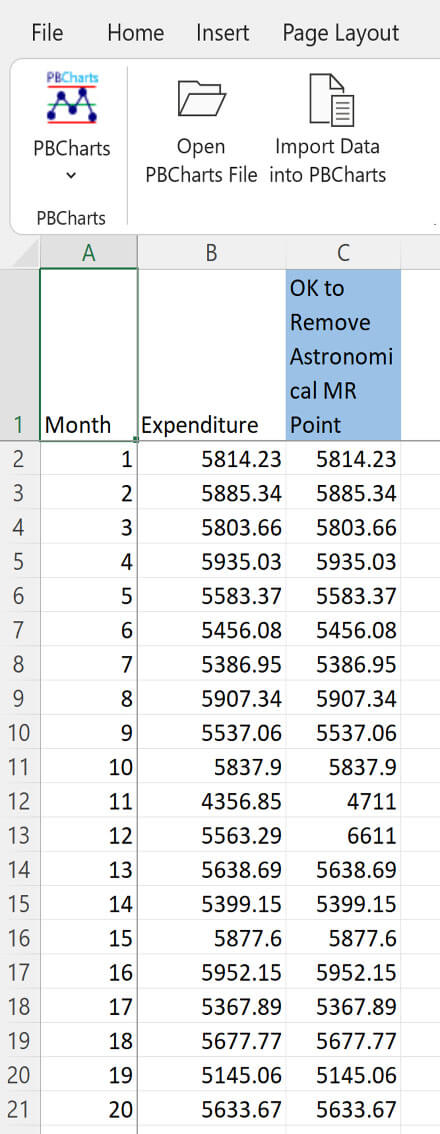
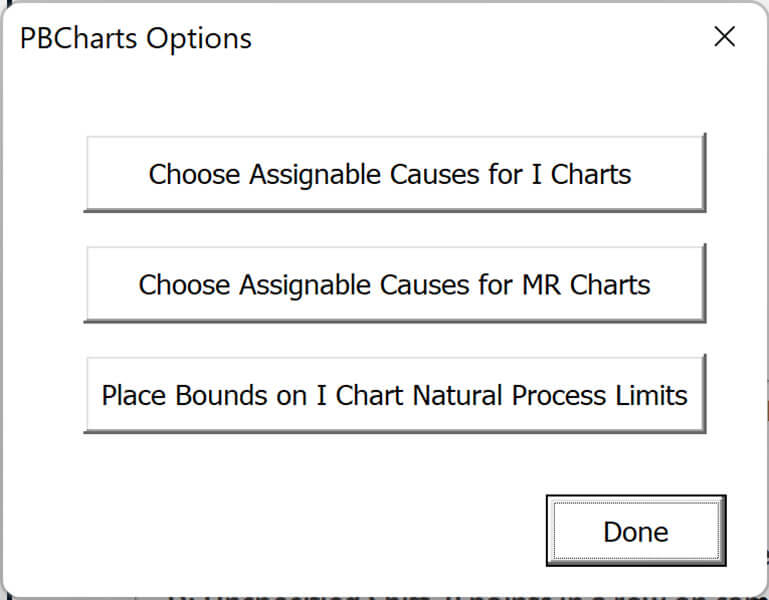
Pressing the Exclusions ![]() button on the PBCharts ribbon will open the Exclusions dialog box.
button on the PBCharts ribbon will open the Exclusions dialog box.
Select Month 12 on the Moving Range Chart, press Apply Changes then Done
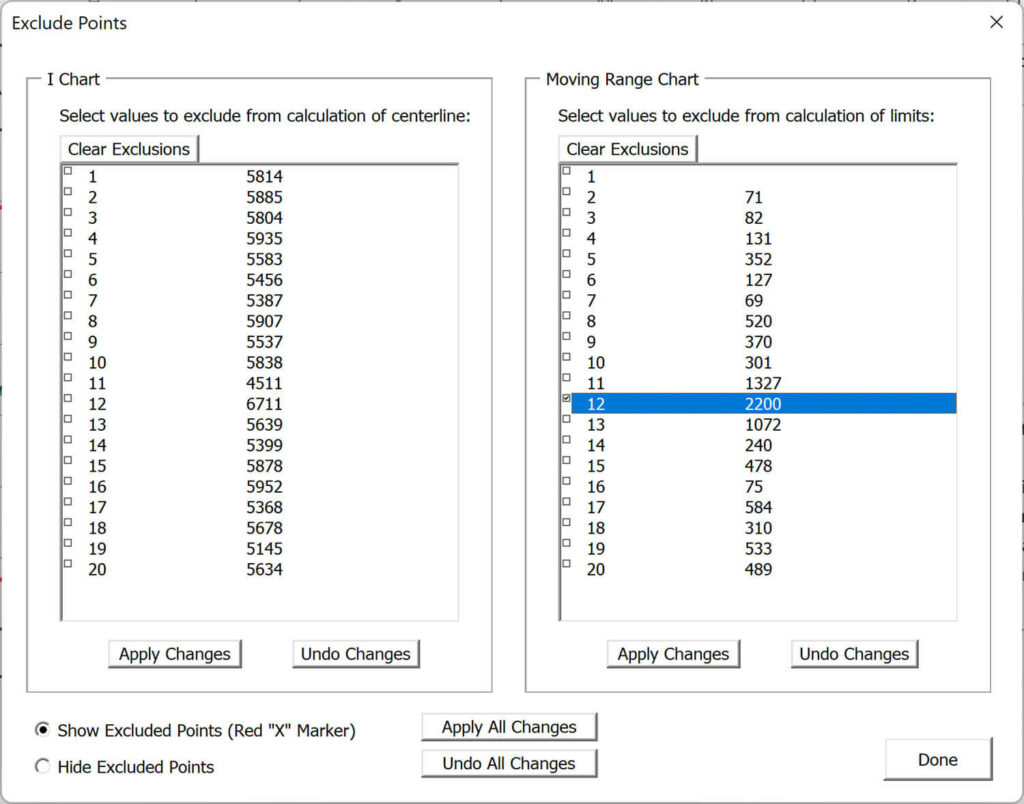
Now the true picture is shown, while the expendatures for Month 11 were low and for Month 12 were high, they are within the normal amount of variation. The limits on the I Chart shrunk by 18%.
Best regards,
Mike Mercer
651-303-0229
Mike@PBCharts.com
http://www.linkedin.com/in/MichaelCMercer
Location of the Guides
No responses / comments so far.