Process Behavior Charts in Excel
Process improvement charts have never been easier!

Process Behavior Charts
PBCharts includes the following types of Process Behavior Charts
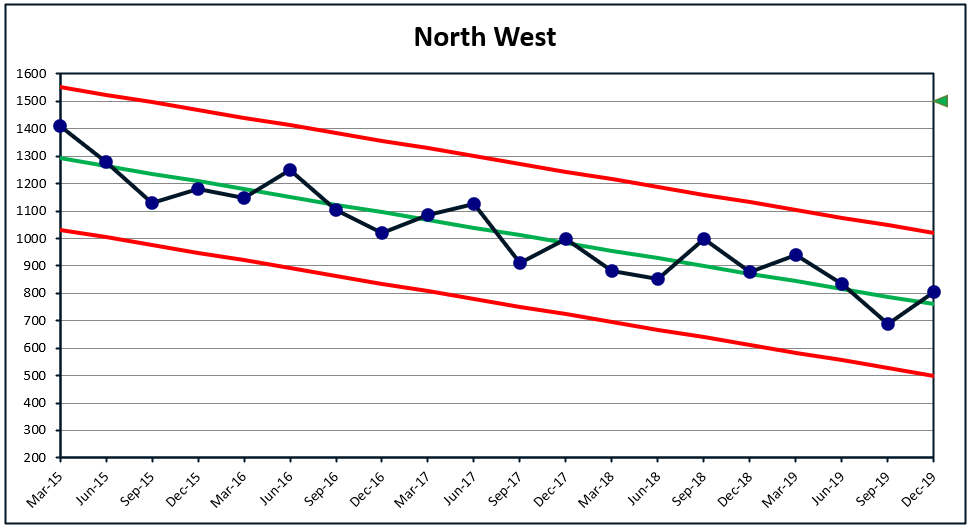
I-Charts
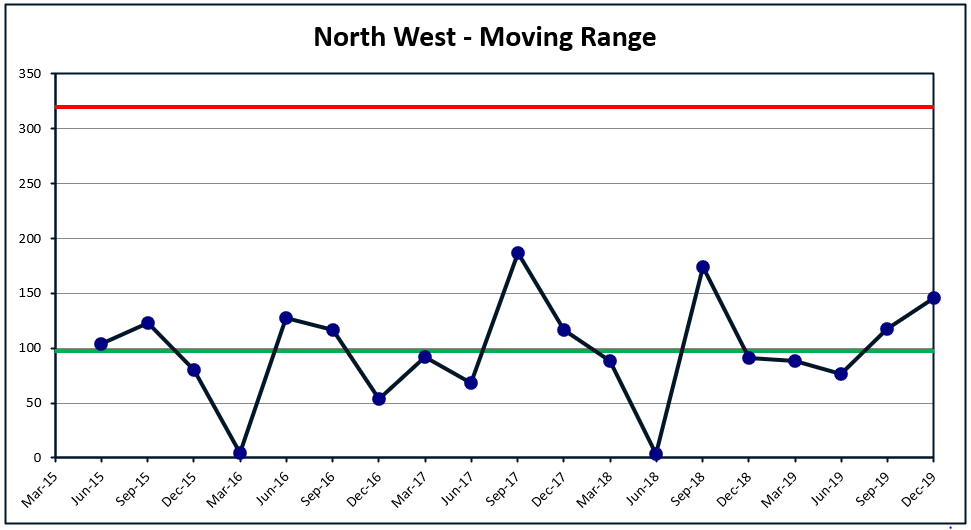
Moving Range Charts
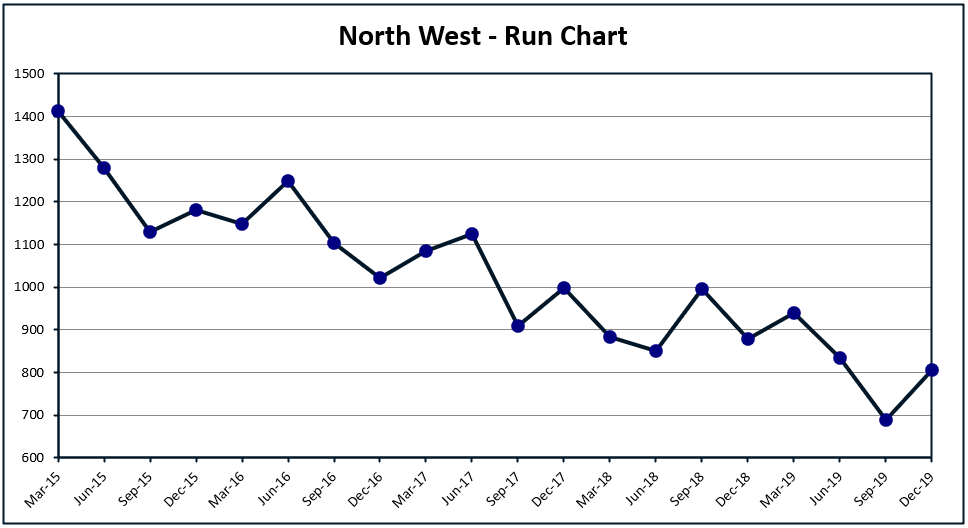
Run Charts
PBCharts — Designed to make your business processes much simpler to understand!
“If you can’t measure it, you can’t manage it.“
Humans sometimes misunderstand the nature of process variations and the effects of process inputs and changes on these variations. Software tools help users understand process variation and improve decisions based on this variation.
PBCharts (Process Behavior Charts) is a simple and intuitive Excel-based business analytics tool. It is designed to allow business leaders to understand their processes better, and to keep a competitive edge in the market. Some people refer to these Process Behavior Charts as XmR Charts or X Charts or I-MR Charts or even PBC a short name for Process Behavior Charts.
Useful tools to model data

Identify trends

Easily export charts

Identify Stages

Different chart styles

Label Points

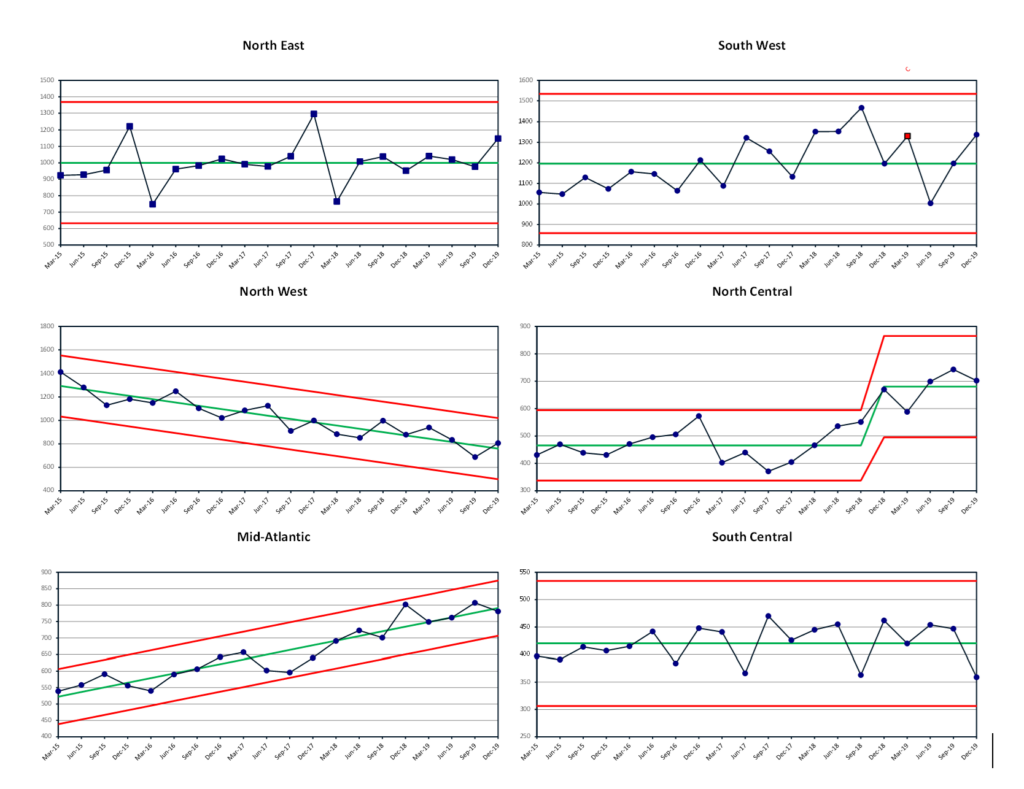
Dashboards
Easily Create and Share Dashboards

Experience the SMARTER & FASTER way to measure variation in a process
With PBCharts Excel Add-In
